
Food Safety Statistics and Data for 2026
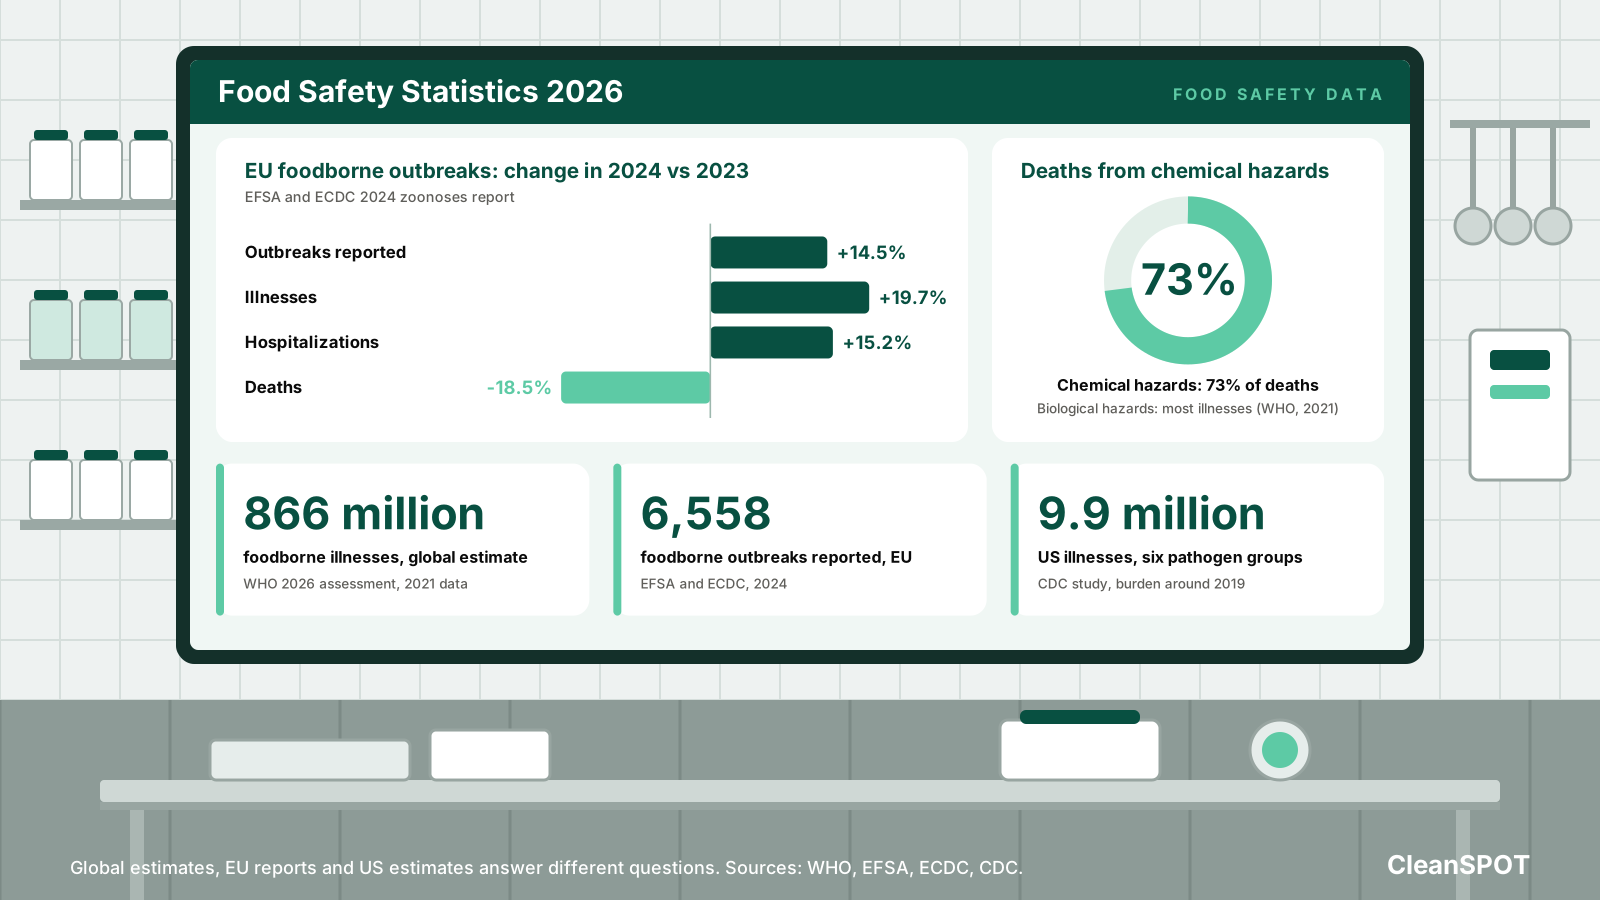
Food safety statistics measure different problems, from illnesses that never reach a laboratory to outbreaks traced to a shared meal. The World Health Organization’s June 2026 assessment estimates 866 million foodborne illnesses annually, using 2021 data. In the EU, authorities reported 6,558 foodborne outbreaks in 2024, according to the EFSA and ECDC zoonoses report.
For food manufacturers, those figures are a starting point for asking where controls can fail. They do not identify the hazard in a particular production room or prove that a specific treatment will prevent an outbreak. Below, we separate global estimates, reported European outbreaks, and US pathogen data, then explain how to use each in facility planning.
- 866 million illnesses annually is WHO’s global estimate based on 2021 data, released in 2026. WHO foodborne disease assessment.
- About 1.5 million deaths annually is the corresponding global estimate for the same reference year. WHO foodborne disease assessment.
- $310 billion in lost productivity was attributed to foodborne disease globally in 2021. WHO economic findings.
- 6,558 foodborne outbreaks were reported in the EU in 2024. EFSA and ECDC 2024 report.
- 62,481 illnesses, 3,336 hospitalizations, and 53 deaths were linked to those EU outbreaks. EFSA and ECDC 2024 report.
- 14.5% more reported outbreaks occurred in the EU in 2024 than in 2023. EFSA and ECDC 2024 report.
- 9.9 million domestically acquired foodborne illnesses were estimated for six major pathogen groups in the US around 2019. The study was published in 2025. CDC original research.
- 53,300 hospitalizations and 931 deaths were estimated for seven major foodborne pathogens in that US assessment. CDC original research.
- About 5.5 million US foodborne illnesses were attributed to norovirus in the same assessment. CDC original research.
- 3,041 confirmed invasive listeriosis cases were reported in the EU in 2024. This is a disease-surveillance count, separate from the outbreak totals above. EFSA and ECDC 2024 report.
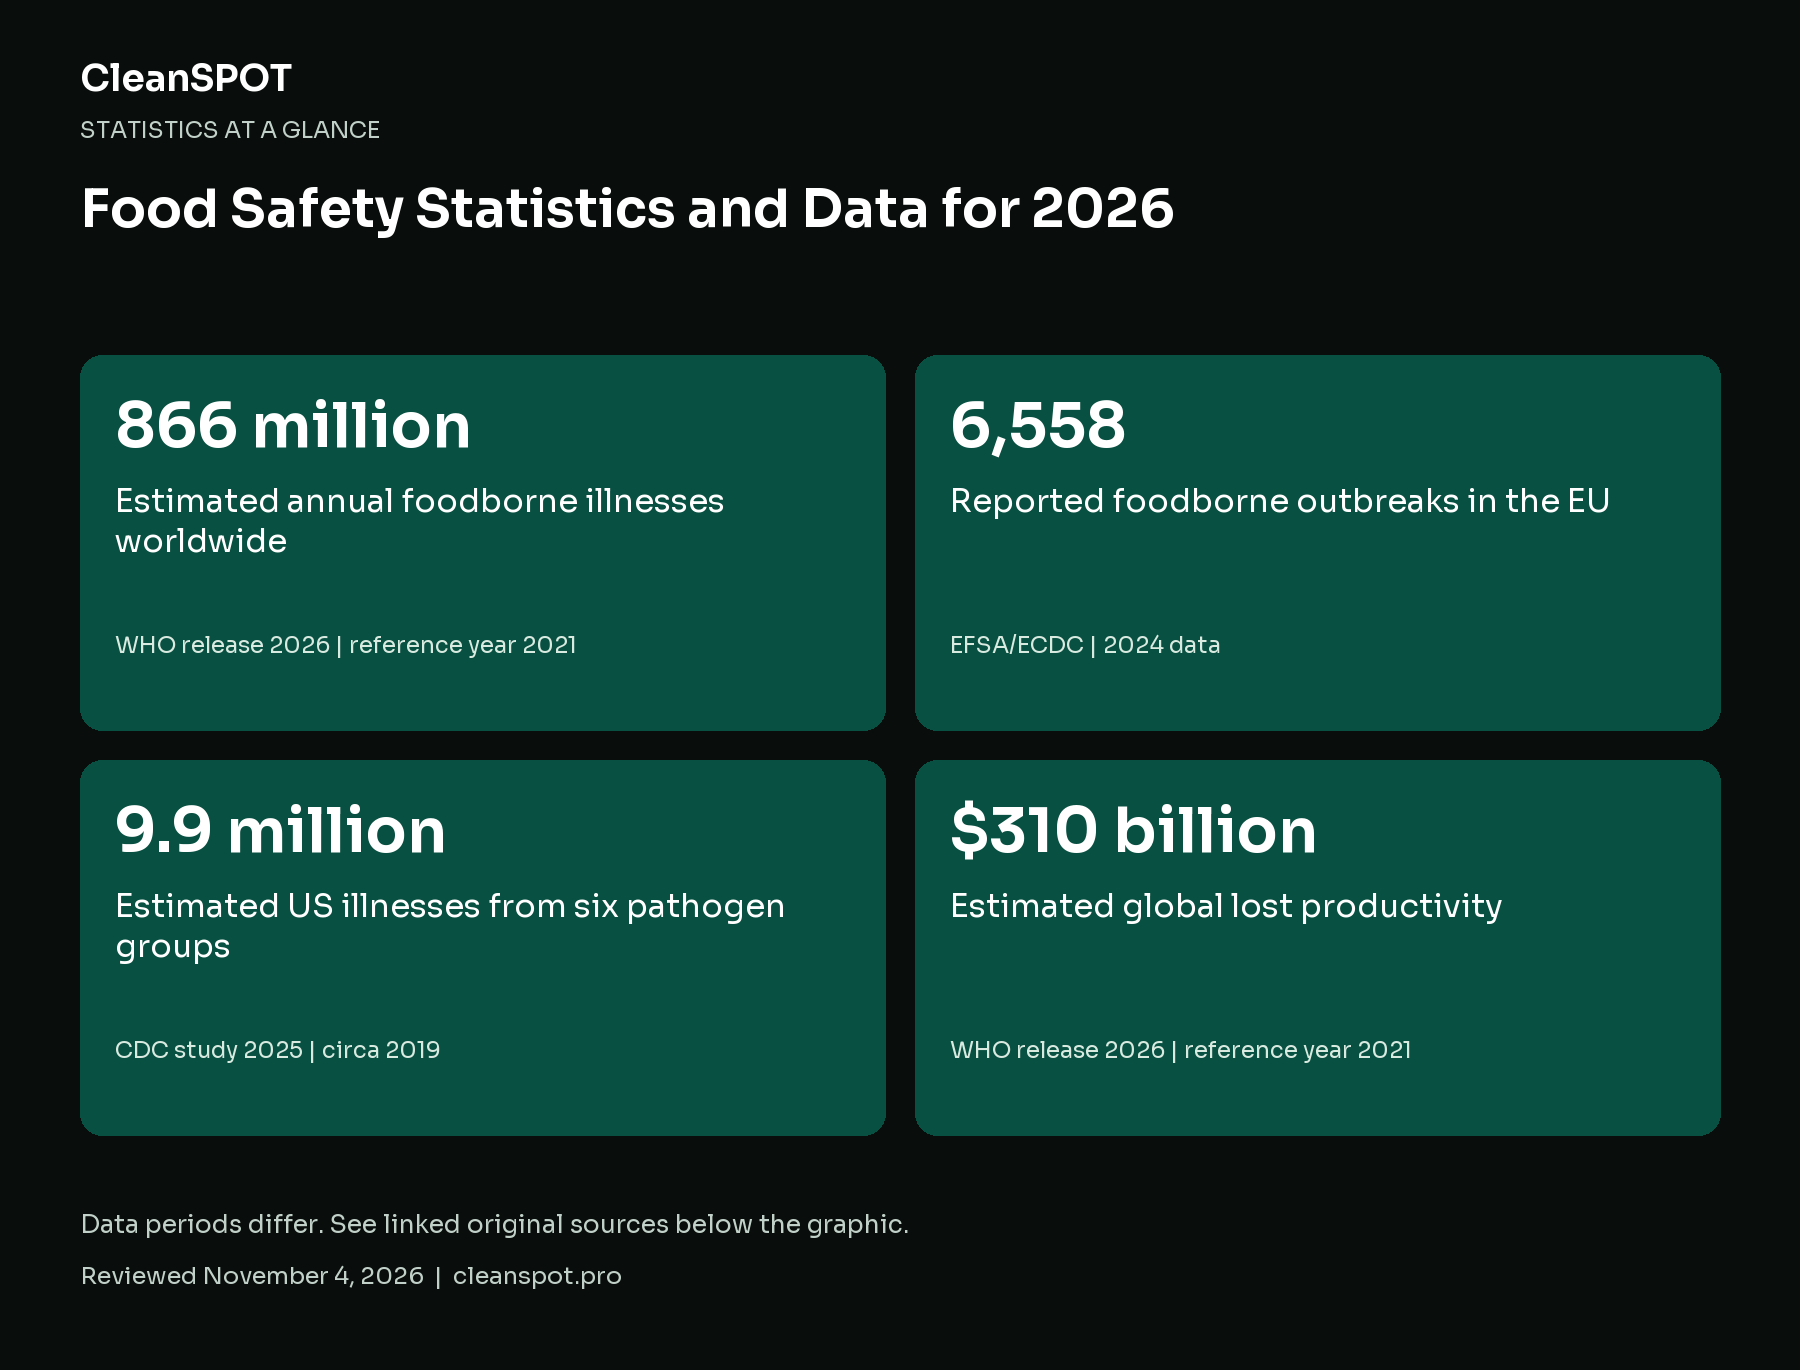
Graphic sources: WHO 2026 assessment · EFSA/ECDC 2024 report · CDC original study
Global Foodborne Disease Estimates Cover More Than Microbes
The WHO 2026 release assessed 42 hazards across 194 countries. Chemical hazards accounted for 73% of estimated deaths in 2021, while biological hazards accounted for most illnesses.
That split changes how a facility should interpret the headline total. A microbial sanitation project addresses a different problem from supplier controls for chemical contamination. Treating a room cannot establish that incoming ingredients meet chemical specifications.
Start by naming the hazard behind an investment request. “Food safety improvement” is too broad to specify a system, choose a sampling method, or decide whether the work succeeded. A useful project brief identifies the product, exposure route, control step, and evidence required before production can continue.
Why the New Global Estimate Is Not a Simple Trend Line
The WHO foodborne disease dataset warns that its updated estimates are not directly comparable with previous releases because the data and methods changed. The larger headline figure should not be presented as proof that illnesses rose by the difference between the old and new totals.
For a presentation or budget request, keep the reference year beside the number. Label the estimate as global, retain its stated scope, and link the original release. If the purpose is to show a trend, use a series produced under a comparable method instead of joining unrelated headline estimates.
This distinction helps prevent a common planning error. A revised burden estimate may strengthen the case for attention without showing that a particular factory’s risk has increased. Local investigations still need local evidence.
European Outbreak Statistics Describe Reported Events
The 2024 EFSA and ECDC report records a 19.7% increase in outbreak-associated illnesses and a 15.2% increase in hospitalizations compared with 2023. Reported deaths fell by 18.5%.
These measures move independently. More recognized outbreaks do not automatically mean that every outbreak became more severe, and a lower death count does not make the increase in illnesses unimportant. Keep the outcomes separate when explaining the data to colleagues.
An outbreak count is most useful when the question concerns recognized incidents. It is less suitable for estimating every illness in a population, including people who never seek care or receive a diagnosis. Do not add the EU outbreak count to a global modeled estimate to create a larger total.
Use Listeria Data to Ask More Specific Questions
Listeriosis deserves attention in ready-to-eat production, but a national case count cannot locate contamination inside a plant. The Canadian Food Inspection Agency’s Listeria guidance explains that the organism can grow at refrigeration temperatures and survive in cold, moist processing environments.
Its guidance connects control measures with environmental sampling, follow-up action, and trend analysis. The practical question is whether the facility can explain a repeated finding, identify where it occurred, and show what changed after corrective action.
Review the sequence around a finding. Was the area sampled during production or after cleaning? Did equipment placement, a maintenance task, or traffic between zones change? Record those details before treating an isolated negative follow-up sample as the whole answer.
For facilities reviewing the room environment, our guide to dew point and condensation explains why temperature and moisture need to be considered together. A room’s average relative humidity cannot, by itself, describe conditions on every cold surface.
US Estimates Need Their Pathogen and Date Labels
The CDC study published in Emerging Infectious Diseases in 2025 estimated illness around 2019. Its total covers selected major pathogens, not every possible cause of foodborne disease.
The US Government Accountability Office’s 2025 review explains that changes in the scope and methods of CDC estimates prevent direct comparisons across releases. A smaller total from a narrower assessment does not demonstrate that national food safety improved by that amount.
For a business operating across borders, retain the geography too. An American pathogen estimate and a European outbreak count answer different questions. Neither should be used as a direct probability that a shipment, production lot, or storage room is contaminated.
Why Illnesses and Hospitalizations Need Separate Attention
Count-based rankings can draw attention toward common illnesses while obscuring less frequent but serious outcomes. When presenting a pathogen profile, show the measure being ranked rather than describing a pathogen as simply “the worst.”
Use illness counts to discuss how widespread a burden may be. Use hospitalizations and deaths to discuss severity within the reported scope. For a facility decision, add product-specific evidence rather than assuming that the pathogen with the largest national count is the only one worth controlling.
A useful internal summary includes the organism, affected product category, relevant process step, and the control owner. This keeps public statistics connected to a real decision without turning them into an unsupported plant-level risk score.
What the Statistics Mean for Food-Production Controls
The FDA preventive-controls rule overview describes a food safety plan built around hazard analysis and risk-based preventive controls for covered facilities. Public statistics can inform that discussion, but the facility’s own products and processes determine the plan.
Before requesting equipment, organize the evidence around the problem to be solved. The following questions can help the quality and engineering teams agree on a brief.
- Which product, room, or process step is in scope?
- What hazard or recurring deviation prompted the review?
- What is already being measured, and who reviews the results?
- What result would justify keeping, changing, or stopping the proposed treatment?
- Which operating conditions must remain within the approved limits?
Keep humidity control and disinfection objectives distinct. A project to stabilize storage conditions needs different acceptance criteria from a microbial treatment cycle. Combining both in one proposal should not erase their separate operating limits or verification needs.
Measure the Process Before Claiming an Outcome
The FDA’s environmental sampling guidance describes sampling as a way to investigate pathogens in processing environments and assess corrective action. Sampling results are evidence about the locations and conditions tested, not a guarantee about every surface or future production run.
Build a record that can support an investigation. Preserve sample locations, timing, methods, operating conditions, and the action taken after a deviation. A total positive-sample count without this context is harder to use when a problem returns.
For treatment planning, our explanation of sterilization versus disinfection separates the required microbial endpoints. Choose the endpoint first, then assess whether the proposed chemistry, equipment, and procedure can support it.
Specify the Room Before Selecting a Fogging System
A facility brief should describe room dimensions, layout, surfaces, existing ventilation, preparation requirements, and available shutdown time. Ask how the treatment will be documented and how staff will know that the space can return to use.
Our hydrogen peroxide fogging systems include mobile and fixed configurations for compatible applications. Their suitability depends on the full process, including the disinfectant’s permitted use and the facility’s validation requirements.
Do not translate a global illness estimate into a percentage reduction promised by a device. Public-health burden data explains why prevention matters. Equipment performance needs evidence for the actual application.
What Is New in the 2026 Data Picture?
The main update is WHO’s expanded assessment released in 2026. For EU outbreak reporting, the annual dataset discussed here covers 2024 and was published in December 2025. The US selected-pathogen research was published in 2025 but describes burden around 2019.
Those dates belong together in an editorial check. “Updated for 2026” means the article was reviewed against available releases, not that every statistic measures events in 2026. Before reusing a number in a sales document or presentation, confirm both its publication date and its reference period.
Keep a short evidence note beside each statistic in your internal materials. Record the population, measure, period, and original source. This makes the next update easier and reduces the chance that a qualified estimate becomes an unqualified claim as it passes between teams.
Turn the Evidence Into a Facility Brief
At CleanSPOT, we work on humidity and disinfection systems for regulated environments, including food production and storage. Share your room conditions, process requirements, and control objective so we can discuss a configuration that fits the facility’s documented needs.
- WHO, foodborne disease assessment (June 2026)
- EFSA and ECDC, EU One Health 2024 Zoonoses Report
- CDC, Emerging Infectious Diseases (2025), foodborne illness estimates
- WHO, Foodborne diseases estimates dataset
- Canadian Food Inspection Agency, Listeria monocytogenes guidance
- US GAO, report GAO-25-107606 (2025)
- US FDA, FSMA preventive controls for human food
- US FDA, Environmental sampling
Share your room conditions, process requirements and control objective so we can discuss a configuration that fits your documented needs.
Request a quote